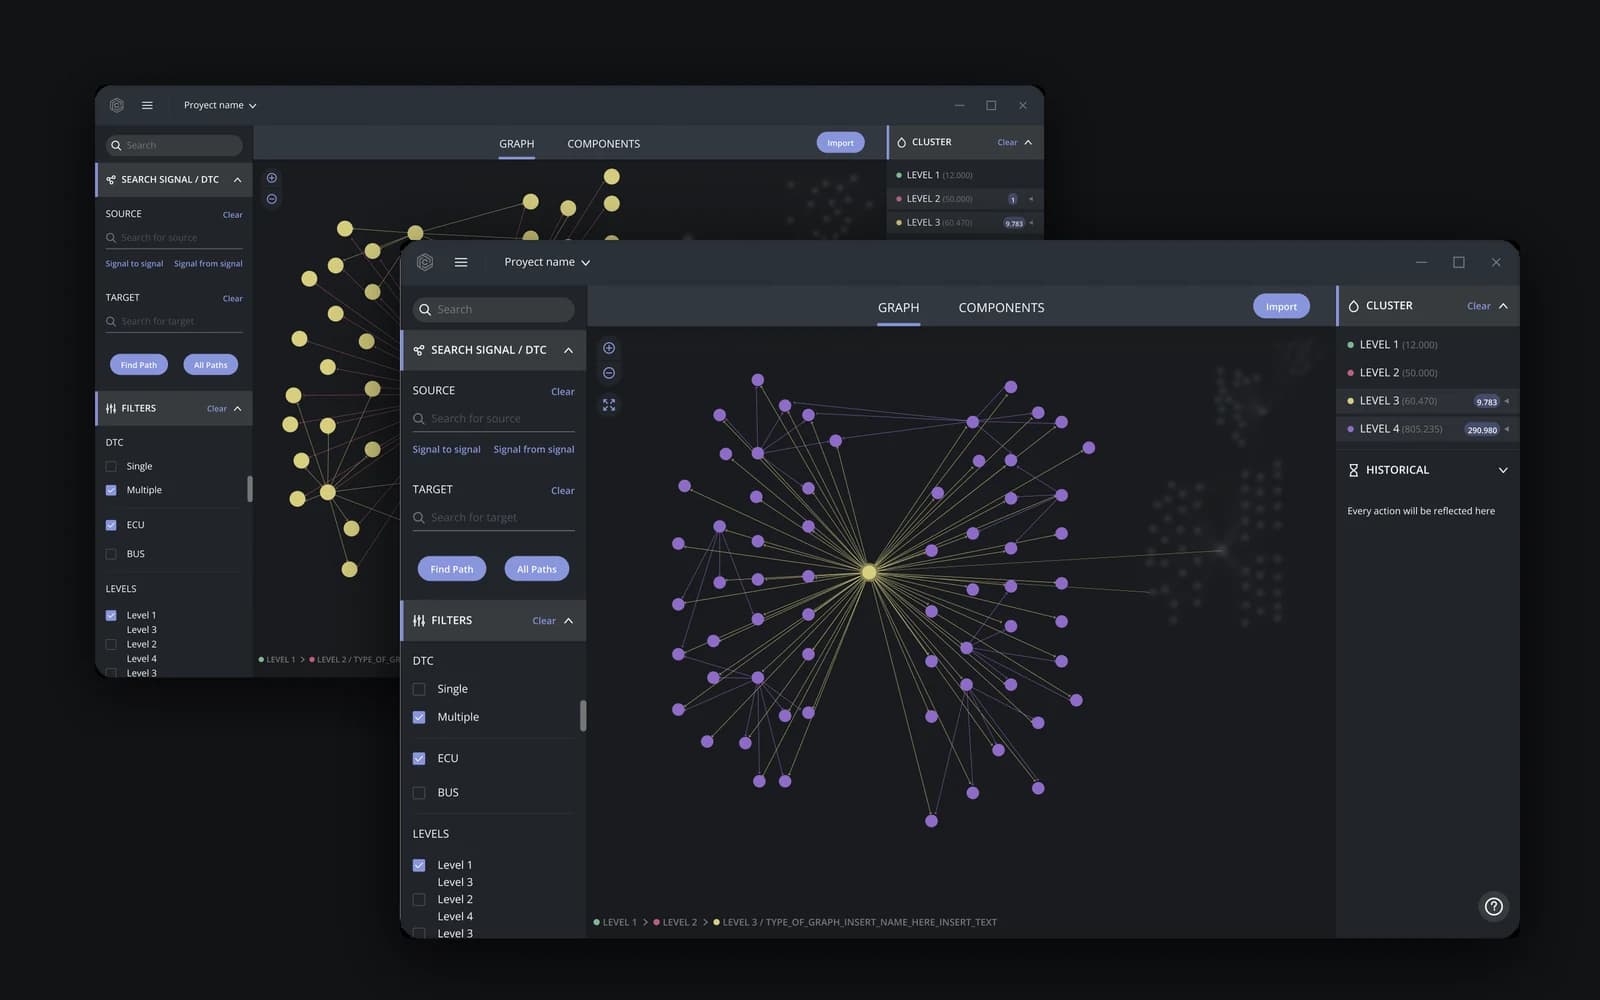
A modern car has dozens of control units (ECUs) talking to each other through thousands of signals, and every fault leaves an error code (DTC). All that information lived in tables and documents only a few people understood. Concentrio wanted to turn it into a visual tool: see at a glance what is connected to what and reach the root of an error in minutes, not days.
02 Explore
A network you can read
The graph is the main screen. Each ECU is a central node surrounded by its signals. Hovering a node lights up its connections and dims everything else, so you can follow one relationship without losing the context of the whole network.
ECU
Hover over the nodes
03 Path
From signal to error
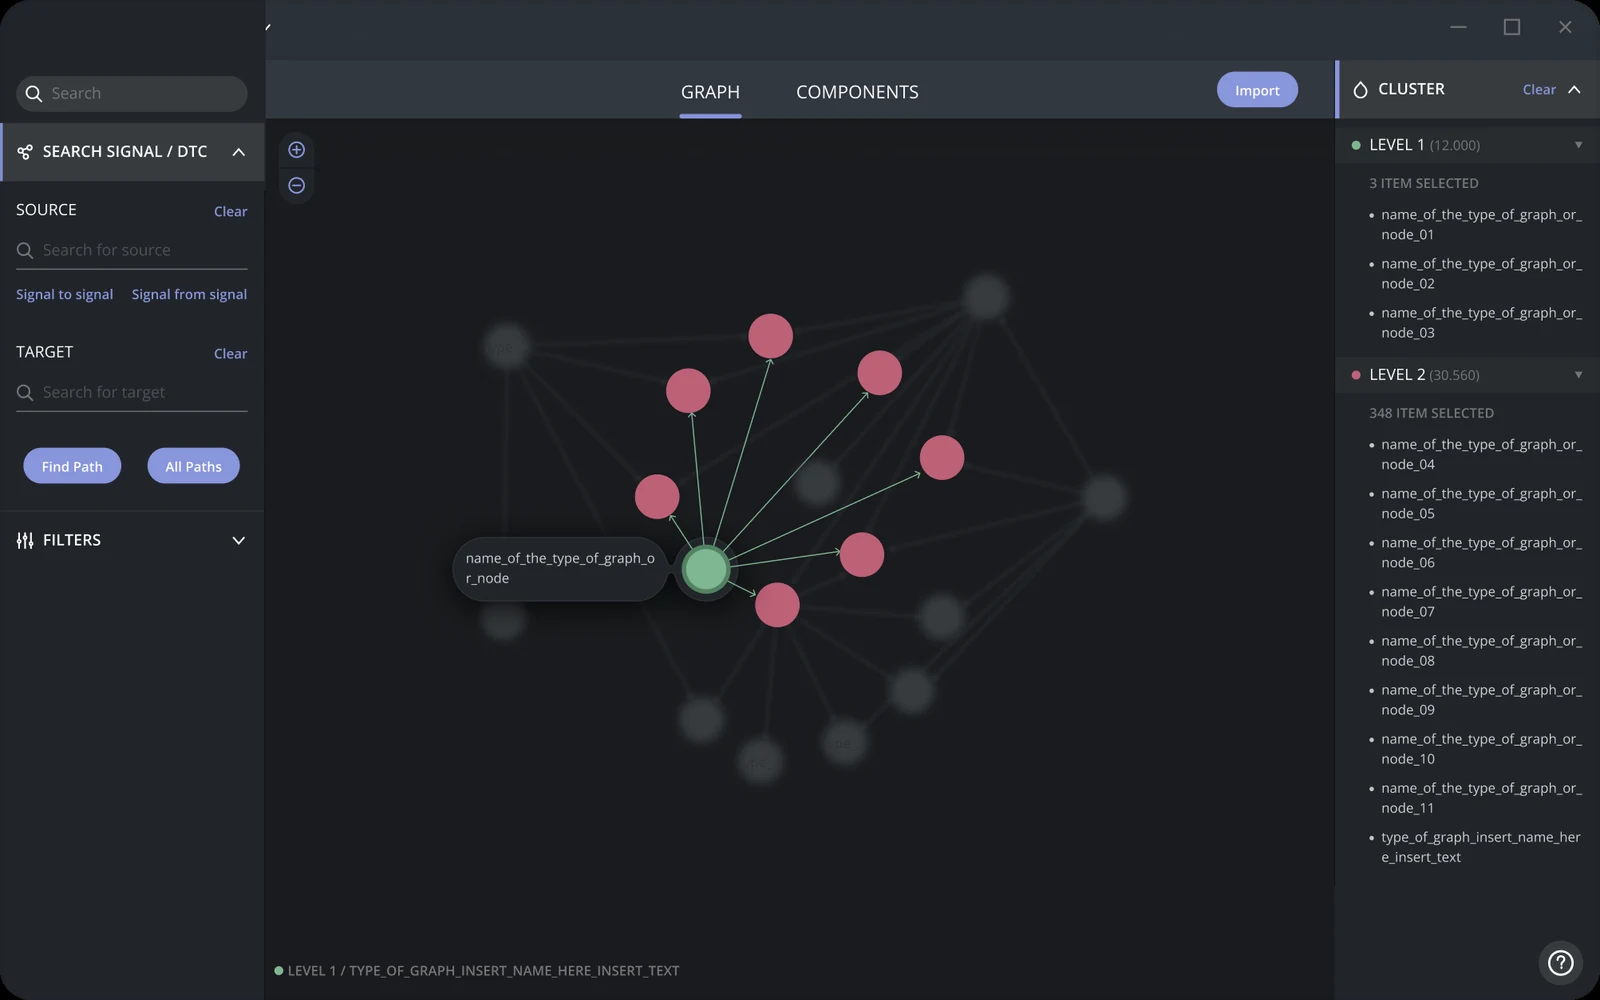
The question that came up most was why an error code fires. By choosing a source and a target, the tool finds the path between a signal and a DTC and draws it on the graph step by step. When needed, it shows every possible path at once.
Signal / DTC
Path found · 8 steps
04 Levels
From system to detail
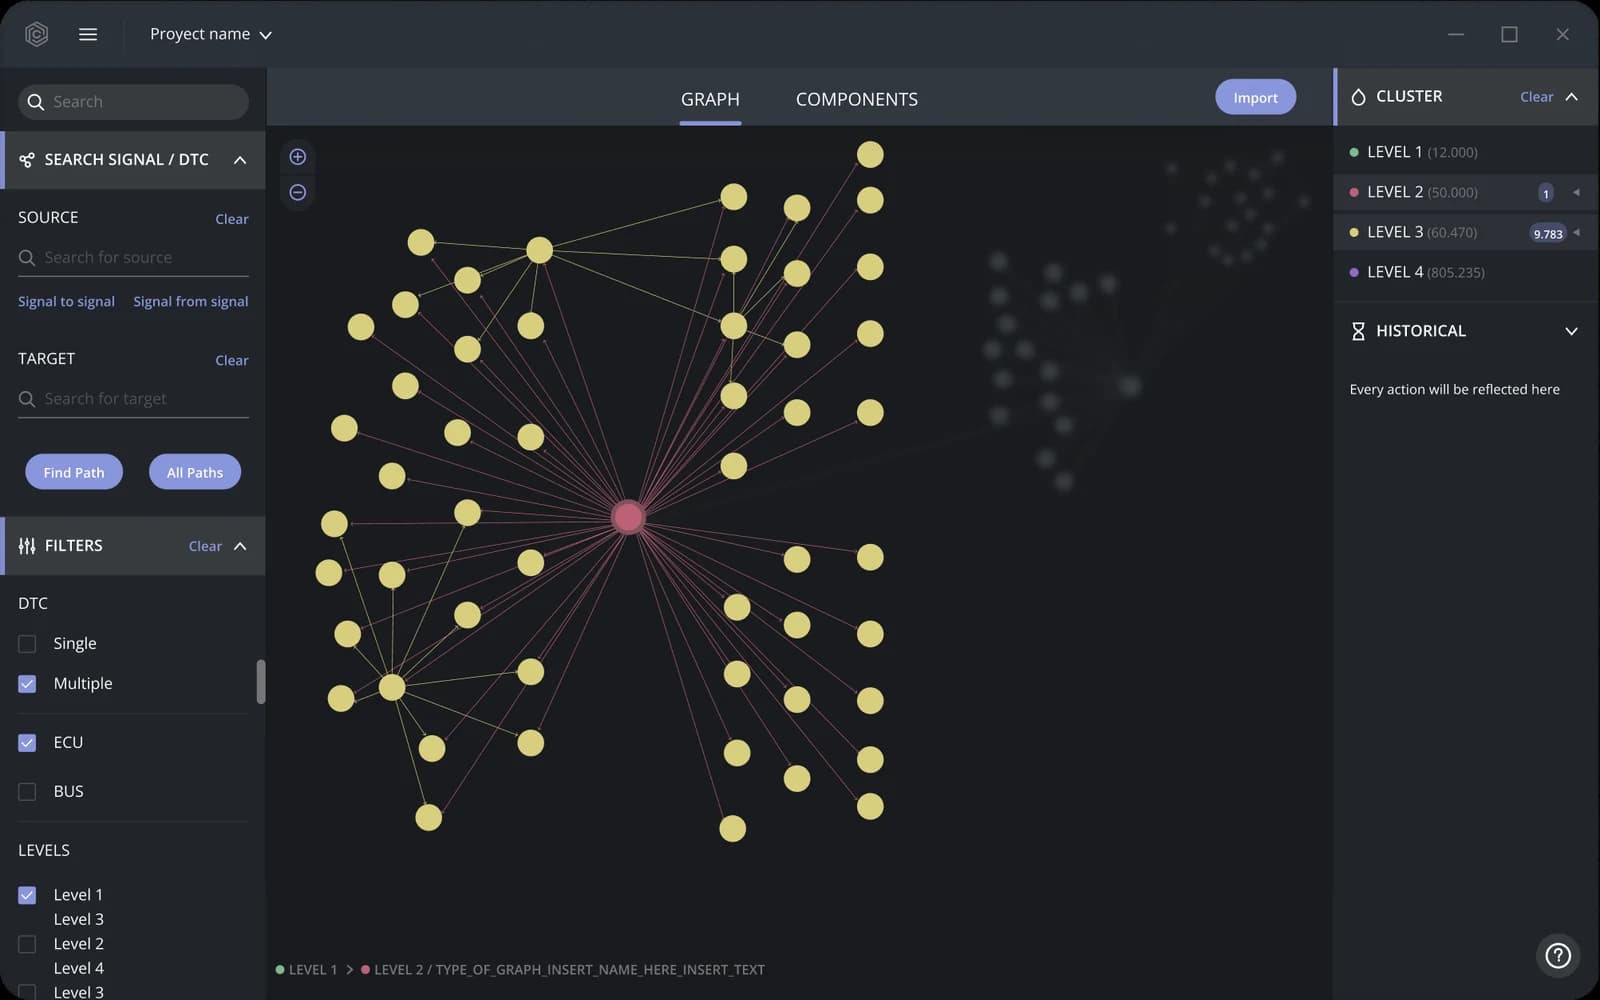
With networks of hundreds of thousands of elements, showing everything at once does not help. Clusters group the network into four levels, from the broadest to the finest, each with its own colour. The history keeps every step so you can go back without fear.
Cluster
05 Panels
Everything at hand, nothing in the way
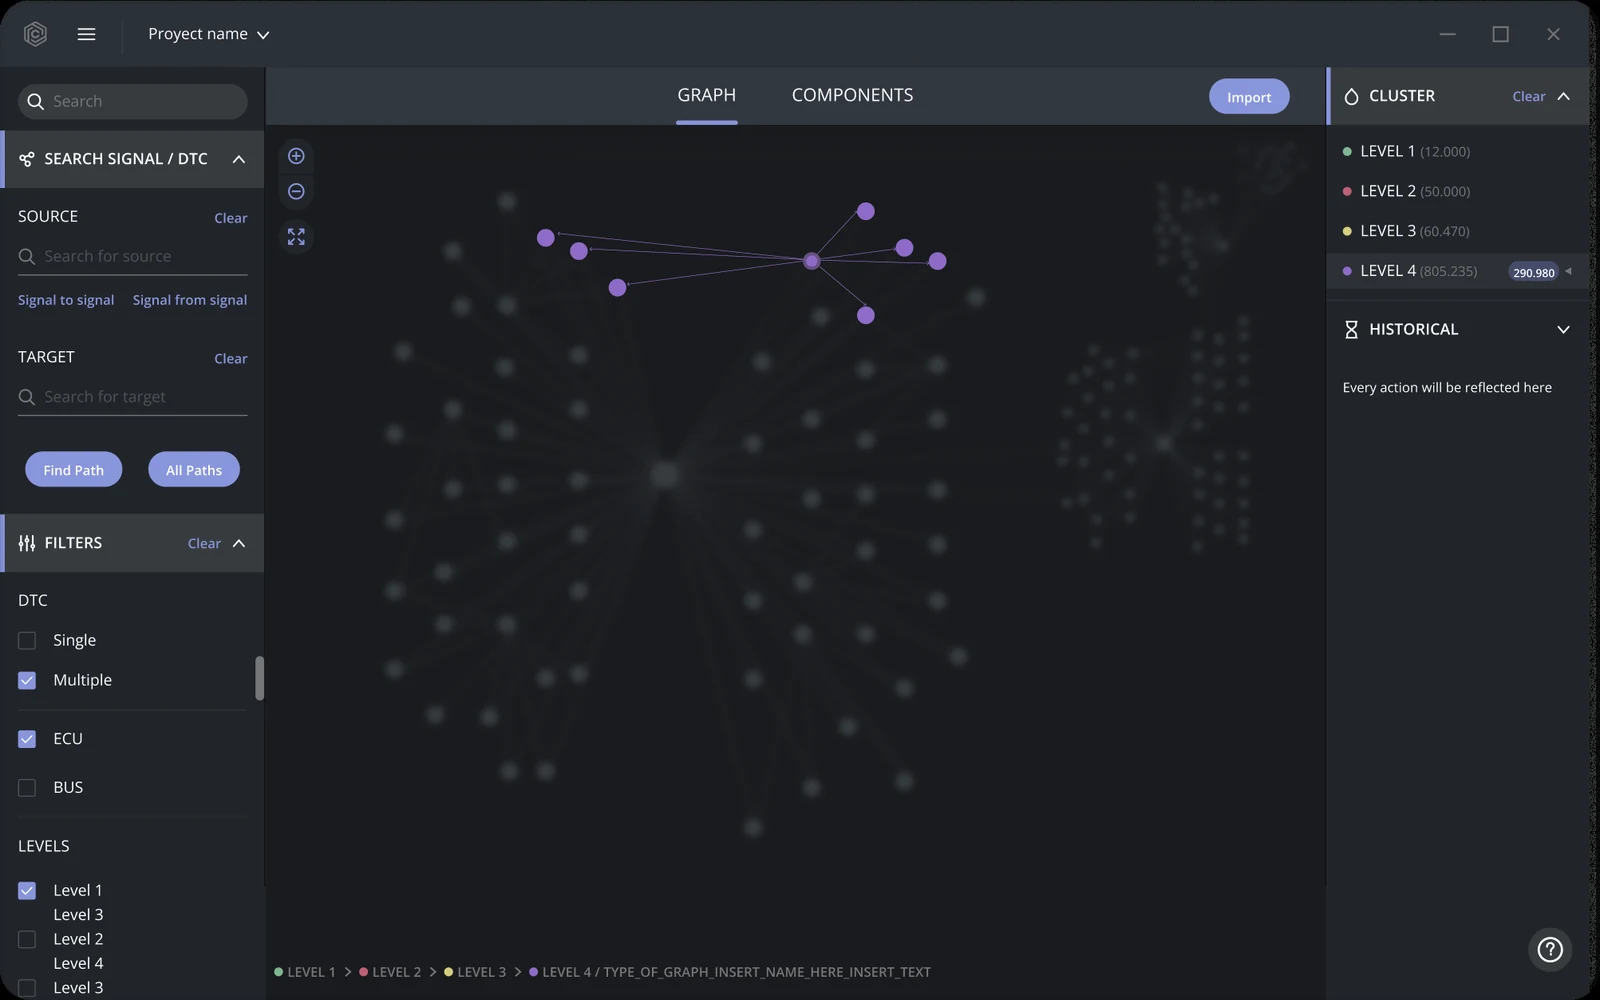
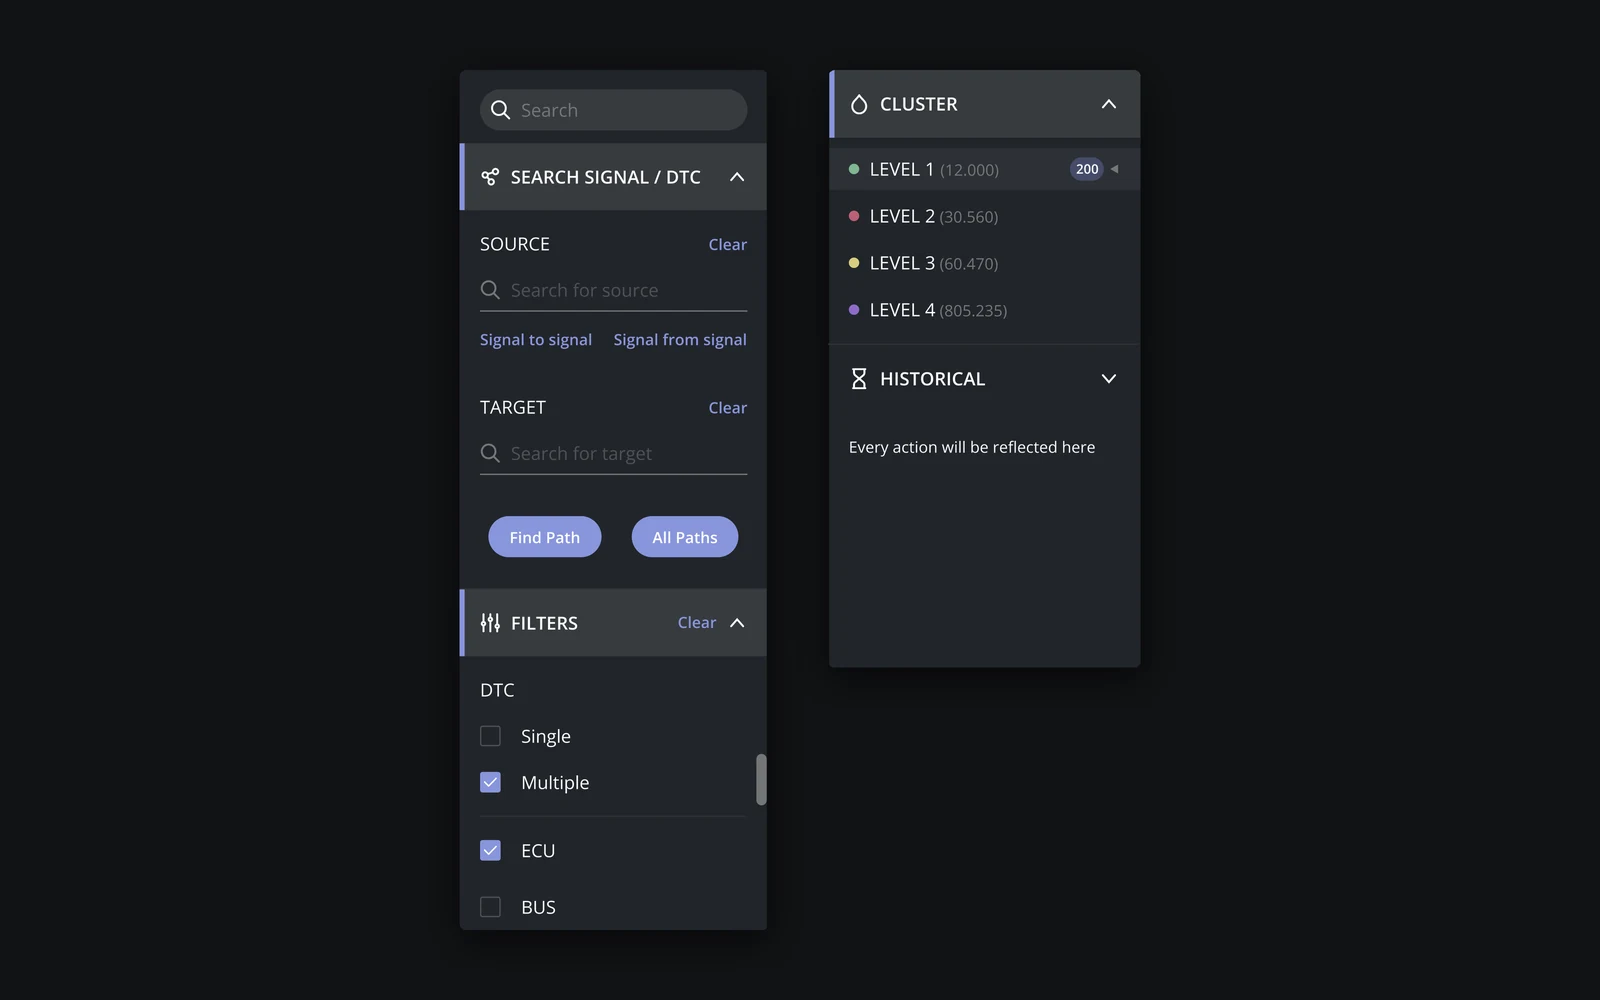
The side panels hold search and filters: look up a signal or DTC, choose source and target, filter by type and jump between levels. They fold by section to give the graph all the room when they are not needed, and the history records every action.
06 Import
New data in three steps
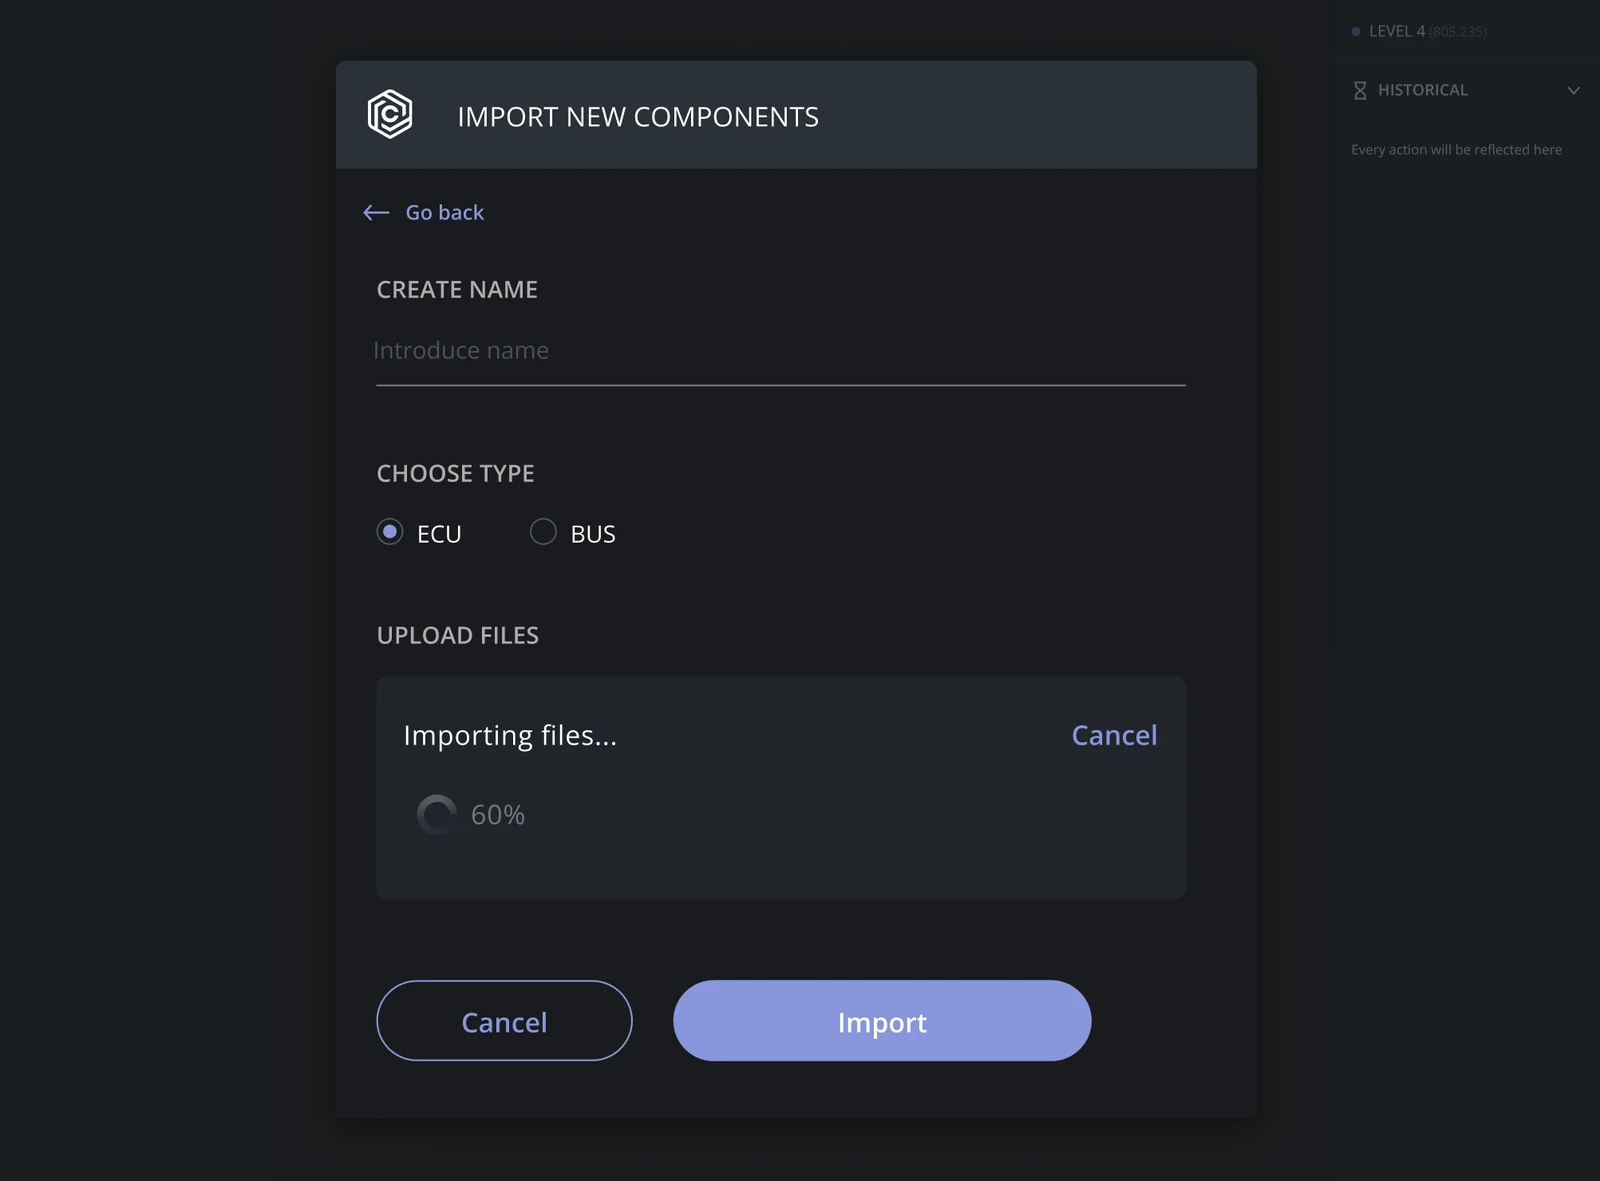
To keep the graph up to date, each team imports its own components from a file: a name, the type (ECU or BUS) and the upload with its progress. Nothing else, so updating the network is not a task that gets postponed.
Create name
Choose type
Upload files
07 Design System
A system to grow without losing order
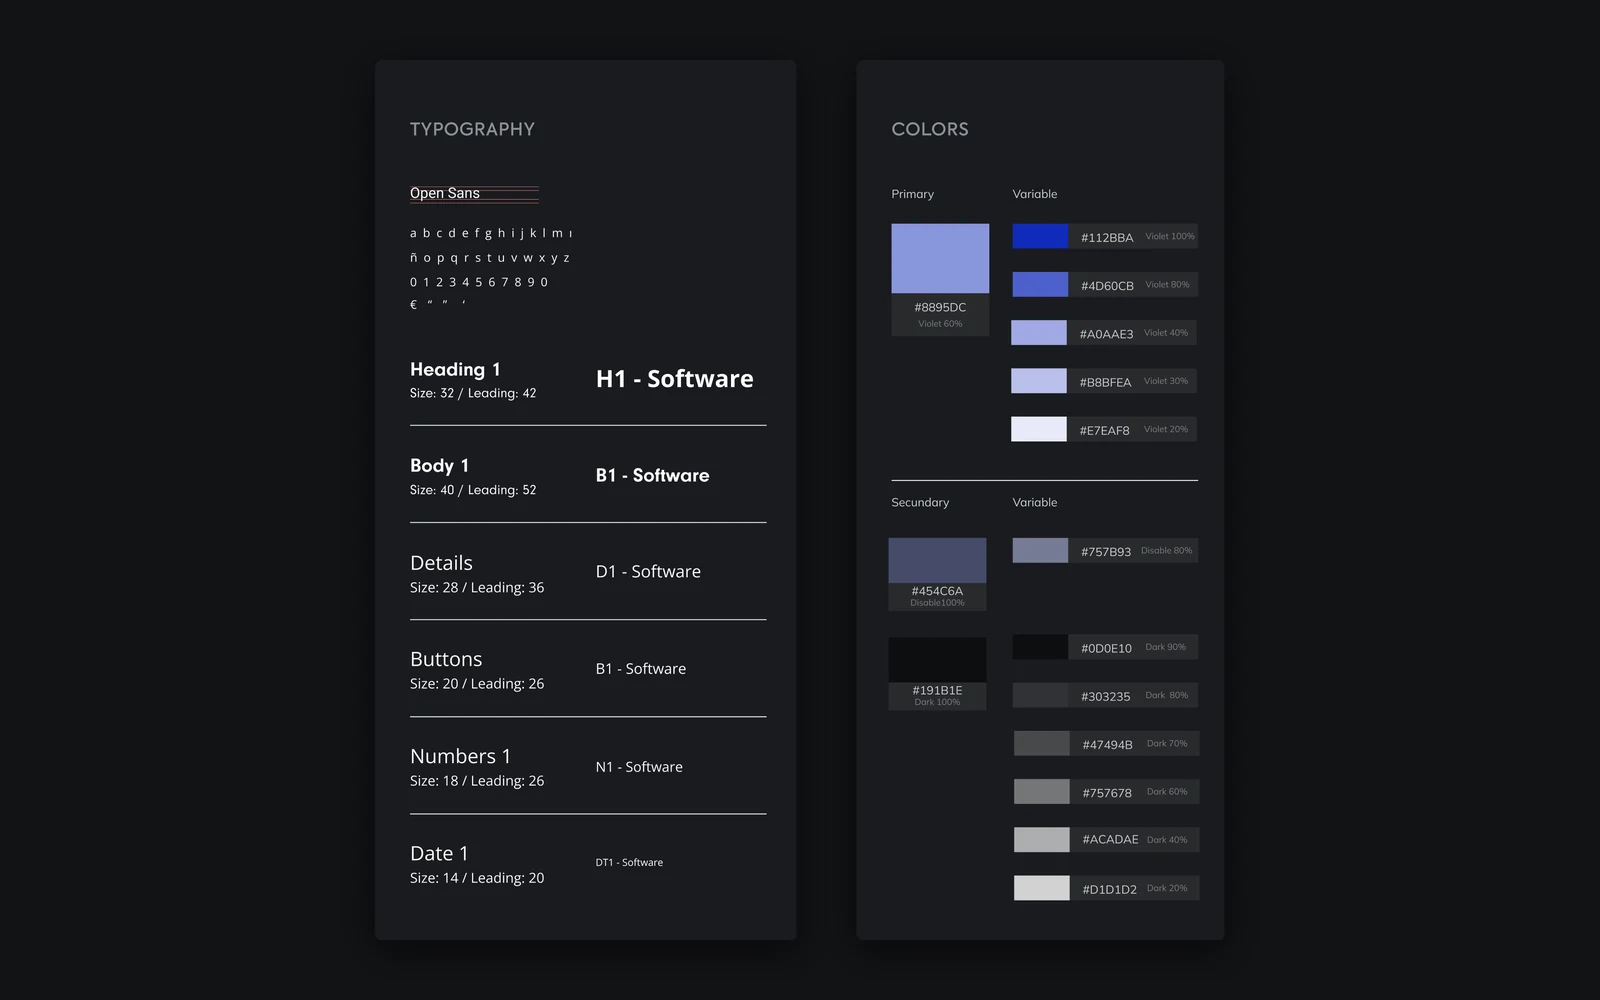
The team spends hours in front of the graph, so the system starts from a dark theme that does not tire the eyes: a violet for action, one colour per cluster level, greys with enough contrast and Open Sans in a short six style scale. On top of those foundations we built a component library so every new screen came from pieces already solved.
- 01Named tokens with a purpose: primary, surfaces, text and one colour per cluster level.
- 02Every component documented with all its states: default, hover, pressed, selected and disabled.
- 03Graph nodes are part of the system too, with states to explore, select and mark paths.
Colour
Primary
Surfaces and text
Cluster levels
Typography · Open Sans
- Heading 132 / 42H1 · Software
- Body 140 / 52B1 · Software
- Details28 / 36D1 · Software
- Buttons20 / 26B1 · Software
- Numbers 118 / 26N1 · 805.235
- Date 114 / 20DT1 · 10 DEC 2019
Buttons
Fields
Search signalDTCDTC-0083Selection
SingleMultipleLevel chips
LEVEL 112.000LEVEL 230.560LEVEL 360.470LEVEL 4805.235Graph nodes
Next project
Sanitas